Activation Funnel Redesign Lab

Most activation analyses stop at the funnel chart.

This one prices the gap and designs the test. I used the public GA4 BigQuery ecommerce dataset to turn user behavior into a growth experiment: find the highest-leverage drop-off segment, size the conservative revenue upside, and define the first variant worth shipping.

  • Published growth case
  • AI-assisted memo
  • Experiment-ready

The signal

One segment carries the opportunity.

Business-readable insight

New users are not a small conversion problem. They are the market.

New users make up 89% of visitors in the dataset. Even though returning users prove that the store can convert buyers, the first-purchase experience is where most of the value is stranded.

Why this segment won

The leverage score gap was not close: new users scored 238,902, about 8.9× higher than the next segment. The low rate matters because it sits on top of 240,441 users, not because it makes an elegant chart.

  • Total unique users: 270,154.
  • Overall activation rate: 1.64%.
  • New users: 240,441 users at 0.64% activation.
  • Returning users: 29,713 users at 9.73% activation.

Why device friction was ruled out

Mobile and desktop cart-to-checkout rates were nearly identical: 44.7% for mobile and 44.3% for desktop. That makes a mobile-only checkout redesign too narrow as the first move.

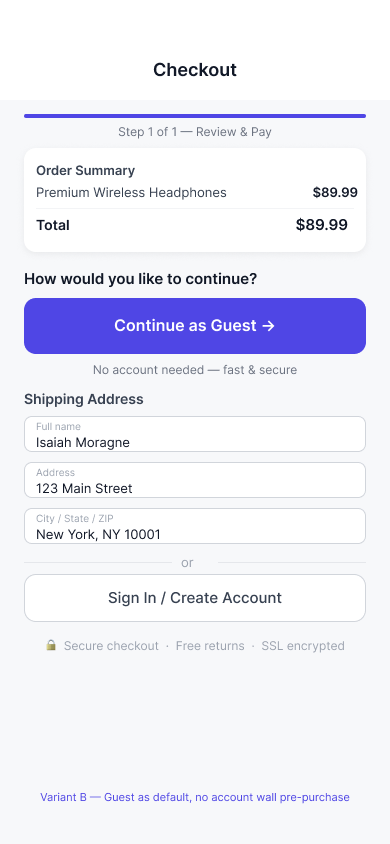
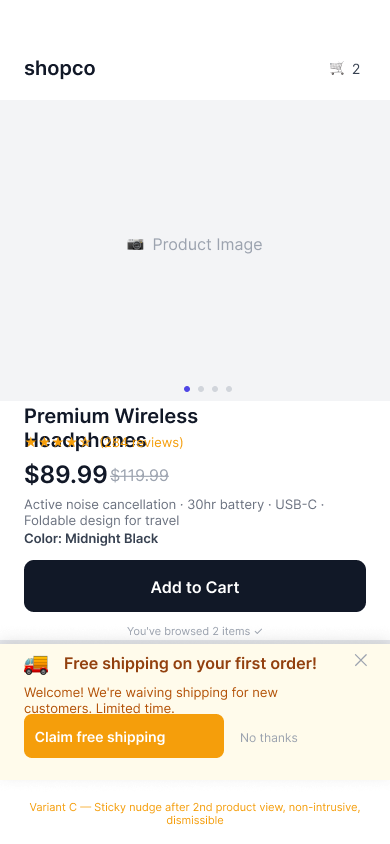
The stronger read is structural first-purchase friction. The recommended intervention focuses on helping a new visitor complete a first order before asking them to become a registered customer.

Analysis pipeline

The project moves from public data to an executive recommendation.

The dataset is bigquery-public-data.ga4_obfuscated_sample_ecommerce.events_*, covering November 2020 through January 2021. The workflow is intentionally layered so each artifact can be inspected by a hiring manager, analyst, or engineer.

  1. 01

    BigQuery event schema audit

    Confirmed event names, date range, purchaser counts, and the purchase-based activation definition.

  2. 02

    Funnel SQL

    Built step-over-step conversion from session start to purchase, including checkout completion.

  3. 03

    Cohort SQL

    Created retention views that feed the Looker Studio cohort dashboard.

  4. 04

    Segmentation notebook

    Ranked device, traffic medium, and new-versus-returning cuts by activation leverage.

  5. 05

    Power and sample-size notebook

    Estimated 12,044 users per group for the +50% relative lift target.

  6. 06

    Dashboards and AI memo

    Connected Looker Studio dashboards and generated a Claude-assisted impact memo with human review.

Experiment design

Variant B is the first test because it removes friction before adding incentives.

The conservative target is a +50% relative lift, moving new-user activation from 0.64% to 0.96%. At a $69.09 average order value, that lift creates an estimated 769 incremental purchasers and $53,130 in incremental revenue over the measurement window.

Control A

Current experience

No changes. New users continue through the existing product and checkout path.

Click to model in sizer ↓

Sequential test

Variant C: first-purchase welcome nudge

After a new user views two or more products, show a non-intrusive free-shipping nudge for the first order. This waits until after Variant B establishes the friction baseline.

Click to model in sizer ↓

Readout

Primary, secondary, guardrail

Primary: new-user activation rate. Secondary: add-to-cart rate. Guardrails: revenue per activated user and account creation rate.

Artifact gallery

Dashboards, mockups, and memo, not just a repo link.

The visual artifacts show the decision path: public data to dashboard, dashboard to one-page memo, memo to intervention, and intervention to test plan.

Looker Studio

Funnel conversion and cohort retention dashboards

Public dashboards connect to BigQuery views for funnel steps and cohort retention. They are linked rather than embedded here to keep the portfolio fast and dependency-light.

Open public dashboards

One-page impact memo

Problem, data, segment, intervention, math, scope, and risks.

The project now includes a polished PDF memo and clean Markdown source. It compresses the case into the format a hiring manager or operator can read in one sitting: what broke, why new users matter, what to test first, and how the $53,130 opportunity was calculated.

Variant B checkout mockup showing guest checkout as the primary path
Variant B: guest checkout fast lane, recommended first.
Variant C product page mockup showing a first-purchase free shipping nudge
Variant C: first-purchase welcome nudge.

AI-generated, human-reviewed memo

Impact memo preview

The memo layer translates the analysis into the language of a growth decision. The full one-page PDF covers the plan's seven required sections: problem, data, segment, proposed intervention, impact estimate, implementation scope, and risks.

Impact estimate

  • Baseline purchases: 240,441 × 0.0064 = 1,539.
  • Projected purchases: 240,441 × 0.0096 = 2,308.
  • Incremental purchasers: 769.
  • Incremental revenue: 769 × $69.09 = $53,130.

Risks to watch

  • Guest checkout may reduce account creation and weaken lifecycle marketing.
  • Guest orders can carry higher fraud exposure.
  • Returning users must be excluded to avoid segment bleed.

Repo architecture

The repository is organized around the analytical workflow.

The case is technical enough to audit, but the structure points back to the business question: where should the team intervene first, and how would we know whether it worked?

Repository folders mapped to workflow outputs
sql/ Schema audit, funnel, cohort, segmentation, and Looker-ready views.
notebooks/ Segment leverage ranking and sample-size calculations.
findings/ Activation definition and the primary new-user drop-off finding.
test_plan/ A/B test plan with variants, metrics, power, duration, and rollout rules.
figma/ Variant B and Variant C intervention mockups.
memo/ One-page impact memo in Markdown and PDF, plus a reproducible PDF build script.
validate.py Environment, BigQuery view, and memo-output validation checks.

Why it matters

Growth PM is not just finding a bad metric.

This case demonstrates the full loop: define activation, identify leverage, rule out tempting but weak explanations, size the business impact, choose the first test, and explain the risk in plain English.

Closing read

From funnel chart to product decision.

The work is useful because it connects product analytics to monetization judgment. The recommendation is not "conversion is low." It is: new users are the highest-leverage segment, the likely first move is guest checkout, the upside can be priced conservatively, and the test has enough sample to read.